
MONDAY, JULY 27, EVENING
(Note: Saturday data; blog is updated weekly, data is captured daily)
Important note: I will be taking a break from logging and analyzing the data in August.
Table of contents:
- Basic information
- Daily Cases by Province
- Cumulative Case Comparisons
- Regional Perspective
- Digging Deeper: Ontario and Quebec
- Cases by Population, and Testing
- Seniors in Ontario (occasional)
- Travel Sources
- Data sources
Cautions:
- If my numbers differ from ANY of the official numbers on the Canada.ca website or on any of the provincial/territorial sites – the public health officials have details that I don’t. (Unfortunately, PHAC has roughly 60% of the data the provinces do, but what they have has a level of details that aren’t published publicly).
- While I have a public health background (I worked for PHAC for 11 years and have a Masters degree in public health) and have taken multiple epidemiology and statistics courses, I’m neither an infectious disease expert nor a biostatistician/epidemiologist. I’m also doing it in my spare time, after a full day of work and early in the morning on Sundays. I’ve caught occasional errors, and it’s quite likely that additional methodological or analytical mistakes remain. (Normally when one does this sort of work, others review it before publication, whereas I’m doing this solo, for fun).
- Take my analysis as a way to add context for the general public, but it’s not definitive. Listen to the federal, provincial, and territorial public health authorities. They have the information!
I repeat: WHERE MY NUMBERS DIFFER FROM OFFICIAL NUMBERS, GO BY THE OFFICIAL NUMBERS. They have the complete data sets, I don’t.
Basic information
Most daily (public) updates are no longer including the source of infection, age, gender, or location of recovery for each case, but most provinces’s COVID-19 websites provide a chart with the age and gender breakdown in that jurisdiction. Several include information about outbreaks in long-term care facilities. Thus, I’ve ceased including that information/analysis here. Canada’s website publishes this story, nationally.
The provinces all publish information on recoveries and deaths as well. Ontario, Quebec, BC, and some smaller provinces are defining recovered as cases two weeks after they first reported their symptoms, rather than one or two weeks after their symptoms cleared. It’s known that severe cases are often very ill two weeks after they first feel unwell, and it takes them 3-4 weeks to partially recover; months to fully recover. The provinces know which cases are considered recovered, and how they identify and report on those recoveries. If you want to see these percentages, they are available on Canada’s website, as well as provincial sites; the public health units have the accurate data.
I will say that the vast majority of known cases of COVID-19 recover at home, in self-isolation. It is true that the case fatality rates for those over the age of 60 are higher, but please remember that the majority of seniors who are not in long-term care facilities also recover. True, as people age, they’re more likely to have the chronic diseases that increase the risk of complications and death. But in Canada, people of all ages have tested positive, people of all age groups have been hospitalized, and people in all age groupings (over age 20) have died. And the deaths have been community based as well as in long-term care facilities. Also worth noting that people of all ages have had permanent health consequences result from this illness. That is why self-isolation is important, to protect our more vulnerable friends and family – but contracting the disease is NOT certain death! Even for seniors.
Since travel was such an important vector for importing the virus, I’m keeping that section; but have moved it to the very bottom since there’s no new publicly-available data. There are Canadians returning home even now, but it’s mandatory for them to self-isolate immediately upon return, so as to prevent spread.
Because community acquired infections are now the main source of infection, it’s important that everyone (a) assume they have it, but are still asymptomatic, and thus (b) stay home, minimizing contact with others and (c) when they do go out, they wear a mask. If everyone diligently followed the recommendations of the public health units and wore a mask when they go out, the cases would finally drop, and businesses could safely reopen and we’ll be able to leave our houses.
Daily Cases by Province
I’ve noticed that a couple provinces (Ontario, Manitoba) are somehow off by two cases and haven’t yet traced back why; the total number of cases for Canada is correct. That said, they’re jurisdictions with enough cases that the charts below tell a reliable enough story. Still, always rely on the official numbers.
My listing of cases are distributed across the provinces as follows:
| Province/Territory | Number of Cases | Percent of Canadian cases |
| Alberta | 10,086 | 8.88% |
| British Columbia | 3419 | 3.01% |
| Manitoba | 386 | 0.34% |
| New Brunswick | 170 | 0.15% |
| Newfoundland | 265 | 0.23% |
| Northwest Territories | 5 | 0.00% |
| Nova Scotia | 1067 | 0.94% |
| Ontario | 38545 | 33.94% |
| Prince Edward Island | 36 | 0.03% |
| Quebec | 58414 | 51.44% |
| Repatriated | 13 | 0.01% |
| Saskatchewan | 1136 | 1.00% |
| Yukon | 14 | 0.01% |
| Nunavut | 0 | 0.00% |
| Total | 113556 |
Note: the above table includes the 13 repatriated Canadians, who contracted Covid-19 while on cruise ships. The reporting at the time did not identify their home provinces since they contracted the illness out of country.
Almost every jurisdiction has seen cases this past week, and many of them are experiencing new outbreaks. Nova Scotia, PEI, Northwest Territories, and Nunavut are the exceptions. It is possible that the opening up has led to too many people thinking that “it’s over” and they can relax their prevention practices. Dr Theresa Tam, Canada’s Chief Public Health Officer, said this week that 60% of the new cases across Canada are in the 20-39 age groups. However, one third of the new cases are in hospital – so they most definitely are not. Plus, if they are asymptomatic or have mild symptoms they mistake for allergies (for example) and then visit their parents or grandparents. So please remind your children that they are not invincible, this is far from over, and they either need to be responsible adults or else they can’t visit (or live with) any family members.
Except for some Atlantic provinces (New Brunswick, Newfoundland, PEI, Nova Scotia) and and the Territories, cases are up this week. Ontario had finally been getting cases down, but the spike started last weekend has continued – but at least it’s not worsening anymore. Quebec’s increase continues, but may also be stabilizing. Neither of their spikes are even came close to where they were through April and early May. Alberta, BC, and Saskatchewan had been doing very well at the start of June, but their outbreaks are still increasing. Note that Alberta and BC are approaching their previous maximums and Saskatchewan has exceeded theirs.
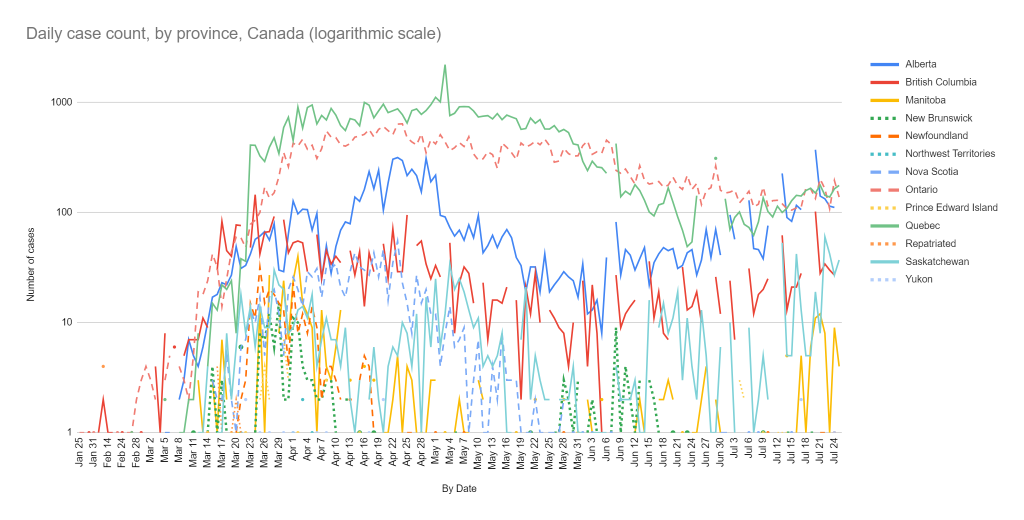
BC initially due to an outbreak due to gathering for a wake; Saskatchewan had outbreaks relating to a workplace; Manitoba had some cases among truckers. Those have largely been resolved. That said, BC now running at slightly higher cases than before, although it’s fairly steady.
Alberta’s cases have steadily increased since the low at the beginning of June, and are now approaching April’s maximum daily peak. That outbreak started in two Hutterite communities; there was a tragic drowning of three teenagers in mid June, and hundreds of people from Alberta, Saskatchewan, and Manitoba’s Hutterite colonies came to help with the week-long search for one of the bodies, and/or for the girls’ funerals. Reportedly, people thought that their communities’ relative isolation gave them protection, plus they wanted to help and support the bereaved. What’s worrisome is that it’s not under control in some areas even though they communities are working closely with their local public health units. Possibly because the infections have already spread beyond those communities into the general population.
And, like with other outbreaks, the community is receiving backlash and being ostracized: please, readers, remember to be kind and to encourage others to be as well.
Manitoba, New Brunswick, and the Yukon all reported cases this past week. The Yukon’s cases were three people who traveled domestically but outside the territory, caught Covid-19, and are recuperating outside the territory. (All provinces are now counting as their own cases caught outside their jurisdiction – even if recuperating elsewhere). New Brunswick’s cases were close contacts of last week’s cases (which were from travel, and one temporary foreign worker), and were at the beginning of the week – they may have halted the outbreak (it takes two weeks to be certain).
Quebec was doing very well until an outbreak in Monteregie, due to 20-somethings going to house-parties and then a bar. Anecdotally, teens and young adults have heard the message that young people don’t get as sick, and have interpreted the opening up as meaning the pandemic is over and they can see their friends as normal. Unfortunately, teens and 20-somethings do contract and transmit the infection, even if they seem to be less likely to get moderate or severe illness (while children under 10 appear to be somewhat protected from catching or transmitting the illness).
Previous outbreaks in PEI and New Brunswick demonstrate, like the ongoing Hutterite outbreak in the West, how easy it is for an outbreak to start – and how important it is to quickly identify and contain it. Each instance was with well-intentioned people who thought everything was fine, but in reality were exposed to someone who was asymptomatic. That will continue to happen; what’s important is for people to do their best to maintain physical distancing, wear masks when they are out, wash their hands, minimize their contact with people outside their household, get tested as soon as they show symptoms
Each province’s data shows the strengths and weaknesses of their case management.
Notes:
- Yes, Ontario and Quebec are the most populous provinces in the country, but BC is third biggest, and has the big (and lovely) city of Vancouver. Alberta is also a fairly large province (fourth biggest), and has two cities. BC shows you can have a substantial population and still control this outbreak; it’s not only East Asian or certain European countries that can accomplish that. On Friday, June 5, the New York Times profiled Dr. Henry for precisely this reason.
- Most provinces are no longer reporting on Sundays, and BC, Alberta, Saskatchewan, Manitoba, PEI, and the territories are also not reporting on Saturdays as well. Most don’t report on statutory holidays (such as Canada Day), either. That’s why there’s gaps in the daily charts – and spikes the first day they report.
- That March jump in Quebec’s cases was when they started reporting probable as well as confirmed cases; the early May spike is when they found 1,300 cases they hadn’t previously reported; the July mini-spike was when they stopped reporting for three days and then changed their minds. Ontario has a similar mid-May spike, of 87 cases, and then 68 more just yesterday. The early June gap-and-spike for all provinces but Ontario was because I missed June 7’s data collection due to a family tragedy, and the cases were captured on June 8.
- In terms of previous large outbreaks: First, Toronto Public Health indicated that Mother’s Day visits was a factor in the spike. Early June brought a large outbreak among migrant workers at a Haldimand-Norfolk (Ontario) farm, weeks after they had been cleared of their 14 day isolation on arrival. Several other farms reported smaller outbreaks among their migrant workers. There was an uptick in cases in Toronto; I haven’t seen reports of the reason, but it was plausibly linked to relaxed distancing behaviours (e.g. the crowds in Trinity Bellwoods Park in Toronto). Then in early July there was an outbreak among migrant workers at Windsor-Essex (Ontario) farms. Mid-July had an outbreak in Monteregie (Quebec) due to youth going to house-parties and then bars.
- New Brunswick’s outbreak: a Cambellton doctor traveled to Quebec to pick up his young child from the child’s mother. He then went to work. The child tested positive six days before he did. There was a spike in cases and New Brunswick’s first two deaths. There were cases in the retirement home and hospital two weeks after the outbreak started, indicating some containment issues. Fortunately, it didn’t spread further. Isolation due to a new household member would have stopped the spread and saved lives, but provinces are not recommending that for parents of children who go back and forth between custodial homes.
- PEI’s outbreak: in early July, an American student studying in PEI had to quarantine in Nova Scotia, where he tested positive. But a 20-something Islander caught it from that student, and infected five others while he was asymptomatic. PEI did two rounds of testing and excellent contact tracing; they caught all the cases, and stopped the outbreak. Kudos to PEI’s public health for managing this outbreak so well, and explaining what happened so that we can all see ‘best practices’.
- The good news is that the anti-racism protests did not lead to an increase in cases in Canada.
The next chart focuses on the most populous provinces, to see more clearly what’s happening with the daily case reports. Note that Quebec’s decline was subtle at first, then picked up speed – and now the roller coaster is starting up the next hill. Ontario’s daily cases declined, popped up, and have been in steady but very slow decline since – this pattern is somewhat unusual, but the charts below will explain it. Alberta’s went up with the meat packing plant outbreaks, went back down, but have since gone up. Note that Alberta may have peaked, but has similar daily numbers to the much larger Ontario and Quebec. BC’s never managed to get lower than around 10 cases a day, and is a little higher this past week – each week is a little higher on average than the previous week.
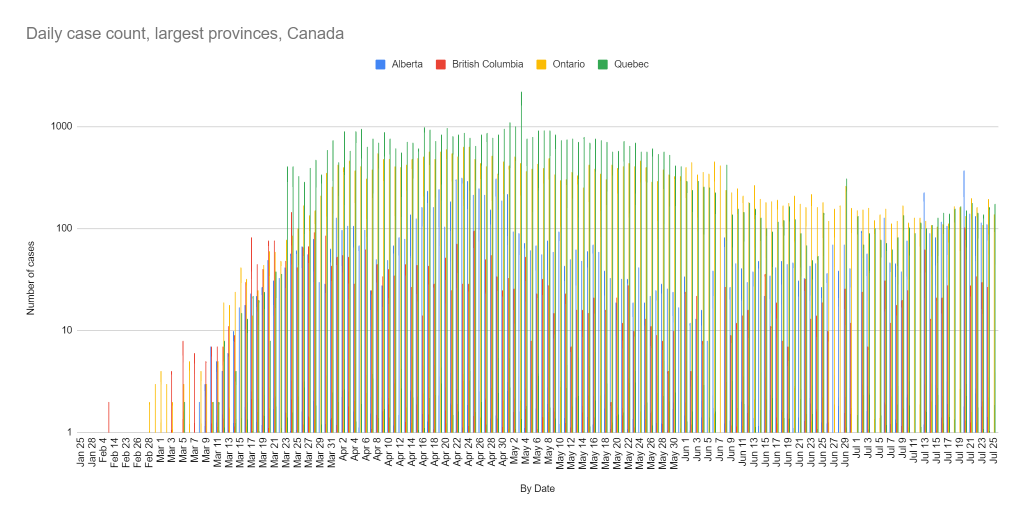
Notes: April 8-13 was Passover and then the Easter long weekend, May 10 was Mother’s Day, May 18 was Victoria Day, May 24 was the start of lovely weather, and in late May/early June many provinces started easing COVID-related restrictions. In April, there were other factors at play as well, such as outbreaks in long term care facilities and at meat processing plants, and BC briefly expanded testing criteria leading to more cases discovered (their testing rates have since gone back down to their baseline levels). In June, there were outbreaks among migrant health workers. But, there was also increased push for people to wear masks, and continue physical distancing when out in public. The anti-racism protests, Father’s Day, and Canada Day seem to have had minimal effect. Public health authorities and expert researchers will determine precisely what happened, in the future.
But as we can see, nicer weather, frustrations over continued lockdowns (with potential lax behaviour), and opening up are having an effect on the virus containment in the provinces that never aimed for elimination of the virus.
On a national level (Chart 3, below), we first stabilized the daily increases of cases, started a very slow decline that was finally starting to speed up – and now the curve is going back up. We saw this in East and Southeast Asia, but only after they’d nearly eliminated all cases. Our curve is more along the lines of the US – and we know what happens when these outbreaks aren’t well managed.
While our first wave has peaked, we never got our national cases truly down, like most developed countries. Our decline was slow compared to other countries, and our resurgence quick. This is not good and doesn’t bode well for the fall/winter. Ontario, Quebec, and Alberta are what’s been driving the national numbers – Quebec’s decline was behind the national drop for the last few weeks, Ontario’s very slow decline is why we didn’t get a proper drop, and then new outbreaks in Quebec and Alberta and across the Prairies are why it’s going up. At a minimum, both Ontario and Quebec need notable declines for the national numbers to really come down.

Note that this chart is different from that on the national, provincial, and some public health unit sites: I’m reporting based on the date the case was publicly announced; they often report based on the date the case’s symptoms started. There’s a built-in delay in the two approaches: the symptoms start, the person goes to get tested, the test results come back as positive, the results are announced. Official systems have information that I don’t.
Cumulative Case Comparisons
Now to explore a little more the story of what the data are telling us.
A different perspective on the above charts is to present the cases since the first day of the outbreak in that jurisdiction, to compare the trajectory of increases of each outbreak in each jurisdiction. This is the approach that databrew is presenting across countries, and BC and Canada are using a similar approach in their epidemiological summaries.
One of the concerns in an epidemic is how fast a particular jurisdiction is doubling the number of cases. In other words – think of it as a measure of whether you’re “flattening the curve”. The more similar the trajectory is to vertical axis, the faster the increase; the more the trajectory resembles the horizontal axis, the better (because it means few, if any, new cases).
Here’s the cumulative cases for Canada, from the start of the outbreak, on a logarithmic scale since the growth is exponential. This is what you see on the Johns Hopkins and other sites that look at the national picture (note: some of the sites compress the vertical axis, making it look flatter).

Again, you can see the effect of declines of the daily case counts – it’s flatter than it was a few months ago, but it’s clearly not flat. But, this doesn’t show the full story. Canada’s situation is not yet optimal. That would be daily national case counts fall to under 100, and the pandemic starts fading out in Canada. Nationally, we’re not there. The slight slope looks innocuous, but the chart is on a logarithmic scale – so a few hundred cases a day, when there’s over 100,000 total cases, looks inconsequential.
The Provincial story
The Canadian story is a provincial/territorial one – and looking at these jurisdictions from day one of each of their outbreaks is a good way of comparing how they’re doing. How quickly are they doubling the number of cases? How quickly did they get a handle on it and start controlling the outbreak in their jurisdiction? Have they flattened the curve, yet?
You can also see the length of the outbreaks from this chart – that’s why some lines are shorter, and some are longer.
Note: This chart has “lines” in grey which represent doubling every two days, every four days, and every eight days (limitations of my software are why it’s so jagged):

All our curves are flatter, and a few are truly flat. This builds on the story above, with the overall daily cases. The flatter the curve the fewer the daily cases – stabilizing daily case counts means the cumulative totals are increasing, just slower, while zero or a handful of daily cases displays as a nearly flat curve.
The curves have shifted over the course of the outbreak, and you can clearly see the impact of each jurisdiction’s restrictions – and who imposed early, successful pandemic controls, who delayed but then succeeded (Nova Scotia), and who delayed and have been less successful (Ontario).
Despite recent cases, PEI, New Brunswick, Newfoundland, Manitoba, Nova Scotia, and the territories have done a very good job controlling their outbreaks, with few (if any) cases on any given day. They have “planked their curves”!
(Yes, I feel sad for them when a case shows up, but I know that (a) it eventually has to happen, and (b) they’ll manage it well).
For the provinces at the top of the chart (Quebec, Ontario, BC, Alberta), remember that with a logarithmic scale, it shows minimal slope even when there are dozens or hundreds of daily cases.
Saskatchewan and BC have curves with a little slope. Saskatchewan’s pattern is to have a small outbreak, manage it, cases taper off, then there’s another outbreak. This current outbreak is their biggest since the spring, so we’ll see how they manage it. BC’s pattern is steady, with a handful of daily cases, never perfect, but consistent.
Alberta was also doing well, but the new outbreak is growing in a worrisome way, and doesn’t seem to be controlled yet.
Quebec’s line was flattening, despite opening up – daily cases were still high but were 10% of what they previously were, so the line was much flatter. We’ll see if that changes.
Ontario’s the only curve that consistently has a visible upward slope, but even it may be (finally) improving.
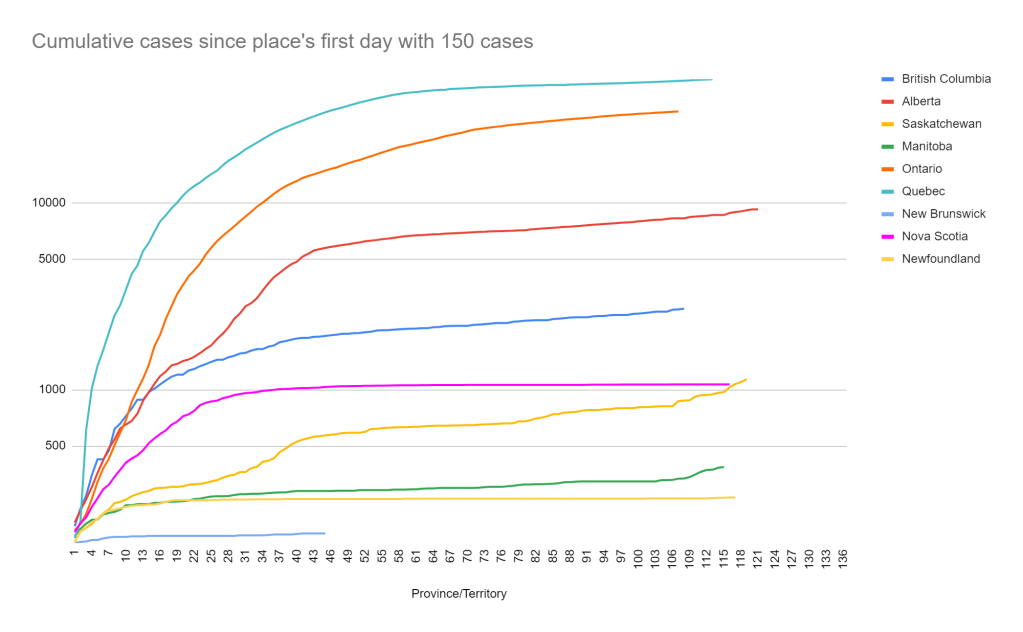
Sometimes looking at the curves after a certain point can show changes in the slope – it’s like zooming in on the chart, so that you can compare how they’ve handled the outbreak. Unlike some websites, I can’t display the data in an interactive way, so I’ll show it with a 150 case cut-off.
All provinces but (tiny) PEI have more than 150 cases – even New Brunswick. So, this chart shows the trajectories for the provinces which have more than 150 cases. New Brunswick, Newfoundland, and Nova Scotia are truly flat, with zero new cases; Manitoba’s almost flat, but has very few cases so its cases are more obvious. Saskatchewan’s curve isn’t very flat, but they seem to control each of their small outbreaks.. BC is a slight but steady slope, with little change. Quebec and Ontario are perhaps a little flatter, but Alberta’s escalating.
Remember that the graph is on a logarithmic scale, so the total of 3 cases in Manitoba show more slope than the 120 cases a day in Quebec.
A fascinating approach (and a video that explains it) charts the exponential growth curves in a way to see, in real time, when case growth slows, and when a jurisdiction has fallen off the exponential growth curve. This analysis maps a rolling total of cases on the horizontal axis and new cases on the vertical axis. Both axes are on the same logarithmic scale.
So, I developed a version that groups every seven days (rolling), to smooth out daily fluctuations and show what’s happening. Just note that I don’t have the tools to display this properly – it’s an overlay of 11 separate charts!
What this shows is the standard exponential trajectory – most outbreaks move in a similar way across the diagonal, and you can see how that happened, until the provinces (one by one) got their outbreaks under control. Above the diagonal (as Newfoundland was, early on) means case growth is faster than the rest, while falling off the diagonal to the horizontal means the daily case growth is slower than the typical exponential increase – in Ontario and Quebec’s case, it’s where cases were roughly the same for weeks. A line pointing down means they’re reporting fewer cases than they did in the previous time period. The steeper the drop, the faster the decline. The goal is a plunge straight down to zero daily cases!
How far the lines stretch to the right reflects the total number of cases – Canada has the most (of course), then Quebec, then Ontario, then Alberta, etc. The height of the highest point of the line shows the maximum rolling count, while the height of the end of the line reflects the most recent week. Both axes are on logarithmic scales, so small provinces’ numbers remain visible, but that does mean that larger differences appear comparatively small (e.g differences between Ontario’s and Quebec’s lines, and Quebec’s and Canada’s lines).
The bounces off the bottom is when a jurisdiction had zero cases and then there’s a couple. Public health experts say that’s normal and expected in an epidemic. The bigger the bounce, the more cases, but if it’s well-managed, it’ll go down with minimal further spread. This is why it’s so important for people to already be staying home, with few contacts, and wearing a mask when out – and for rapid testing, contact tracing, and people going into complete and strict isolation when they test positive.

Despite the poor overlay, you can still get a sense of what’s happening:
Canada, as a whole, remains off the exponential trajectory. We were improving, but we’re officially back into growth once again. The improvement was real – but so are the case increases. Public Health needs to crack down now or else we’ll be back in full outbreak and lockdowns within a month. This chart shows the changes real time – that’s why this is my favourite chart.
The steeper the curve’s drop, the better. Quebec was pointing sharply down – a sign of their excellent progress with notable drops in daily cases even with the opening up. But things slipped, possibly triggered by young people’s lax behaviour, and now they are just as steeply heading back up. They need to dramatically improve their testing (more below) and contact tracing to get this under control before it spirals out. This virus spreads exponentially so there’s no room for “wait and see”.
Ontario came off the exponential path before Quebec, but has struggled to bring the cases down. There was a lengthy stall to to outbreaks among migrant workers, struggling to bring the greater Toronto under control, and issues with some other health regions; it’s been a slow and subtle decline. This chart does show that it is, indeed, a decline – even when not all that visible on the other charts. But it’s no longer declining. Ontario was the last to show the increase – but they had so much trouble getting any decrease, I worry how long it will take them to get back on track.
Alberta (orange) had brought daily cases down to nearly zero, but is now increasing at a rate faster than the original exponential curve. BC (purple) was declining, then stalled out, and is now quite clearly increasing. Saskatchewan (purple dots) keeps bringing cases down to close to zero, experiencing a new outbreak, and repeat – hence the hops – but is now be increasing exponentially. Manitoba (orange dots) had very small hops – a few cases, resolved quickly, then back to zero, but now has a bigger than previous increase. New Brunswick had cases and is back to zero (x-axis), while Newfoundland and Yukon (not shown) had new cases but seem largely well controlled. Only Nova Scotia (blue dots) and PEI (red dots) had no cases this past week.
While it would be ideal to stay at zero new cases indefinitely, the reality is that with other jurisdictions still in outbreak, that’s not possible. Thus, the test is whether these initial cases spread to others, and whether the province can bring cases down to negligible – watch the height and width of the “hops”, and if they go up to fewer than five cases and then quickly come back down with minimal horizontal distance, that’s a sign of a jurisdiction that is managing this pandemic well.
What was driving these numbers? True, Ontario and Quebec grappled with terrible outbreaks in long term care facilities, Alberta and Quebec had large outbreaks in meat processing plants, Ontario has outbreaks among migrant farm workers, Alberta among a religious community, Quebec among partying young adults. But there’s also issues with grossly inadequate testing and contact tracing, confusing messaging, lack of enforcement, not isolating cases separate from their households, not mandating mask wearing, and a lack of foresight/learning from others’ experience (e.g. Singapore’s migrant worker outbreak more than a month ago). They’re just not managing this as well as other jurisdictions – internationally, it’s unusual to have as long a peak as Canada has had, and that’s due to the outbreaks in Ontario and Quebec. B.C., California’s major cities, and the role model European and East Asian countries, have equal or bigger cities than Toronto and Montreal and prove that the problem is mismanagement rather than population size or cultural differences.
The lesson is that both effective and ineffective pandemic mitigation/suppression efforts are highly visible by now.
The Regional Perspective
Some of the analyses out of the US break their cases out by region, so I thought to do the same: West (BC, Alberta, Saskatchewan, Manitoba), Central (Ontario, Quebec), and Atlantic (Nova Scotia, New Brunswick, Newfoundland & Labrador, PEI). I didn’t include the North (Northwest Territories, Yukon, Nunavut) because their 16 cases are so dwarfed by the other regions it would not be visible on the chart.
As you can see, this pandemic in Canada is the “Ontario and Quebec” show:

But, Central Canada’s improving, and what’s going on in the West is now a significant part of the current story.
Looking at it each region individually (charts 8a-8c), you can see that Atlantic Canada’s cases have tapered off to nearly nothing, resembling the curves of the best of the countries worldwide – occasional cases, but they have avoided a second wave (so far) and controlled each imported outbreak. Central Canada’s cases were falling, they were getting their outbreaks under control. But it never tapered off, and now it’s going up a bit, again. Western Canada’s cases dropped nicely, and then have increased again – like countries which relaxed before they had their outbreaks fully under control, and are now facing a second wave – or part two of the first one.
Charts 8a-8c show the shape of the curves; of course the number of cases varies dramatically between the regions (note the values on the Y-axes!).


Digging deeper: Ontario and Quebec
To further explore what’s going on in Ontario and Quebec, I broke out these two provinces by their public health units. Just as seeing the provinces is helpful to better understand the Canadian curves, seeing it by public health unit helps us understand the provincial curves.
In Quebec (chart 9), you can see that Montreal, Laval, Lanaudiere, Mauricie, Estrie, and Chaudière-Appalaches, Gaspésie, Abitibi-Témiscamingue, North Shore, Terre-Cries, and Northern Quebec are still flat or flattening out. Quebec City has now joined these regions.
It had gone down to the 10s and 20s (daily cases) a day in Montreal, down from over 400 but it’s now up to 60s-90s each day; that’s why the curve has more slope again, if you look closely (at over 28,000 total cases in Montreal alone, it will take hundreds of cases a day again for an obvious slope).
However, Montérégie, Laurentians, the Outaouais, Saguenay, and Bas St Laurent are still increasing.
This shows that the efforts are having an effect in some parts of the province, but there is still work to do. When greater Montreal area improved, it’s showed up in the Quebec reporting – but the continued cases in Monteregie and the Laurentians are worrisome. The outbreak in Montérégie is not yet under control, still with the 30s and 40s each day.

It’s messy and a bit hard to read, but the daily increases for Quebec illustrates the above a bit better; you can really see the decline and then recent increase in Montreal, Laval, and Monteregie. Launaudiere increased then may be improving, and Laurentians is just steady with no progress.
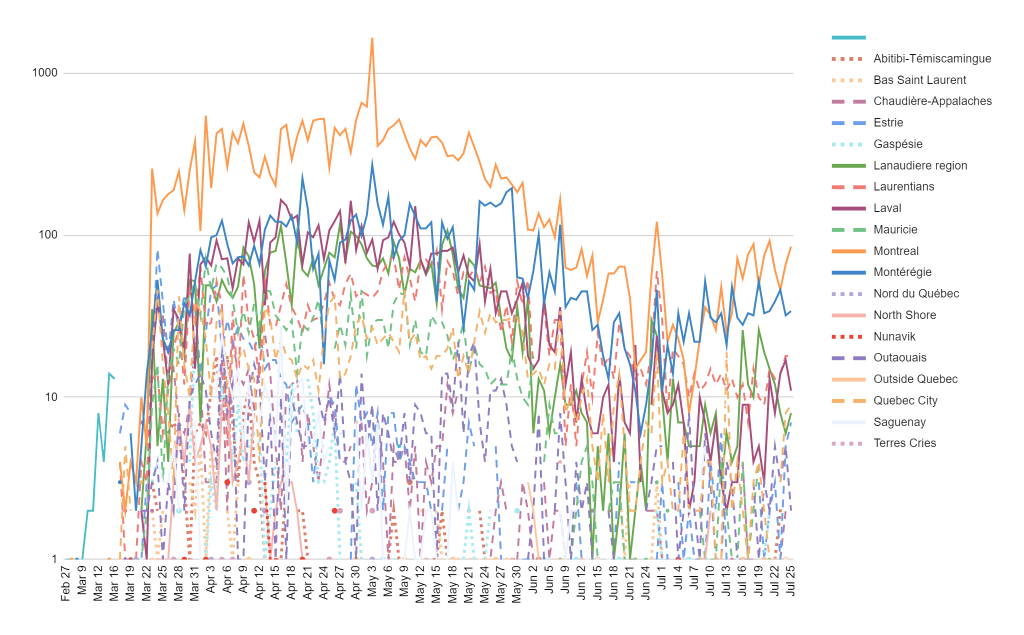
Don’t worry about that spike in every region on June 29 – that’s just because Quebec didn’t report for three days, so the catch-up made them look bad. The daily totals during those three days were similar to before and after that period – and they learned their lesson to report daily when their daily cases are high! (Alberta hasn’t changed that – and so had 400 cases to report today!).
Ontario’s story is not dissimilar. Toronto, as the largest city, has the most cases (over 13,000 – more than any province other than Ontario and Quebec, but still half of Montreal’s); Ontario reports that the greater Toronto area (includes Toronto, Peel, York, and Durham public health regions) accounts for most current cases. (*)
Durham, Waterloo, Middlesex-London, Hamilton, Niagara, Halton, Haldimond-Norfolk, Leeds-Grenville, and Lambton are the only curves that have stayed flattened. Curves which are less flat than the numbers would indicate are Toronto, Peel, York, Simcoe-Muskoka; they are all still improving nicely but apparently it’s not showing up yet on this type of chart.
There were notable increases in Ottawa, Windsor-Essex, Wellington-Dufferin-Guelph, Chatham-Kent, and Southwestern.

The northern public health units have generally the fewest cases (the pastel dots at the bottom) – and minimal case increases, which is good as they have the least capacity to manage large outbreaks. The public health units with the largest cities have had the biggest outbreaks, and may finally be starting to slow. In the middle are small cities – and some areas which have disproportionately bad outbreaks for their populations (population standardized case reports not shown), and some which have beautiful, flat curves. Most of these small and medium public health units seem to be getting a handle on their outbreaks, with few (or no) daily cases.
And you can see what’s happening with this messy chart of the daily increases for Ontario – declining cases in Toronto then stalling/declining more slowly; Peel stalled, went up, and is now possibly declining; Ottawa was doing great and then soared to more than Toronto (young people were having parties indoors and going to bars); Windsor-Essex is still having problems and spiking higher than Toronto and Peel due to continued migrant-worker outbreaks; Chatham-Kent had a spike, as has Simcoe-Muskoka. York however has continued to improve.

Someone (ok, my boss) requested a breakdown of Ottawa-Gatineau, so I did that as well as the Greater Toronto region.
The outbreak was much more severe on the Ottawa side, as compared to the Outaouais, but they aligned from mid-May until mid-July and are back to Ottawa soaring over the Outaouais.

Toronto proper had far more cases than the other health units in the GTA; Peel was fairly stable all through April, increased towards the end of May, and hasn’t really improved since early June until possibly this week. Durham had a few cases, and has since tapered off to very similar to where Ottawa was – they’ve done well on case counts, although it’s worth noting that once population is taken into account, their case rate per 100,000 is similar but a little higher than Ottawa’s (Durham: 251.8, Ottawa: 226.5, not shown)

Note: the gaps in Ontario’s charts by public health unit was because they only reported for the entire province for a number of days.
While I would love to do the same for Montreal, those public health units cover massive geographic areas far beyond the city, so it doesn’t make sense to do the same analysis. Fortunately, Ontario’s plans to restructure the health units in the same way haven’t yet been implemented, even if 34 separate units is a lot to keep track of and graph! (There’s got to be a happy medium between the two approaches).
Cases by Population and Testing
Daily case count is one thing – but how does that compare to the population size? This chart shows the cases by population. Canada has a little over 37 million people. Population data comes from Statistics Canada’s quarterly population estimates.
The outbreak in Quebec is the largest in Canada in both absolute numbers and proportionally – it dwarfs the other provinces’ outbreaks, even Ontario’s. Ontario’s cases per million population have exceeded Alberta’s rate. Nova Scotia’s outbreak is also comparatively larger than that of the remaining provinces and territories, and Saskatchewan’s small-then-contain-small-then-contain cycle has resulted in a growing bar, and a noticeably higher rate than BC’s. In fact, BC’s is notable for the small size of their outbreak relative to population.

How has this changed over time? This shows the cumulative case growth, relative to the population size of these provinces and territories. To show how much bigger the outbreak in Quebec is than in the other provinces, I did NOT use a logarithmic scale.
Notice that Quebec’s curve has escalated after starting to flatten a little, as have Alberta’s and Saskatchewan’s. Alberta was parallel to Ontario for a while, and is now accelerating Ontario. Nova Scotia’s outbreak is more severe than that of other Atlantic provinces – it’s not proportionally larger numbers from a larger population. BC’s growing slowly and steadily here, but now is accelerating due to a doubling of daily case numbers. And again, you can see which curves are flattening. Ontario’s was shifting to a flatter curve, but is now accelerating again. And, you can see the growth in Manitoba and Yukon.

At the start of the pandemic, Quebec boasted about their high testing rate, but that has long since been surpassed by Ontario. Until last week, Quebec’s testing rate was an abysmal 5,000-8,000 a day – they didn’t have a chance to get their outbreak under control with such inadequate testing for a province their size. They’ve increased their testing at the end of each week, but some days are down to the previous lows (16,000 samples processed, on Saturday). Ontario’s managed to bring up its testing rate to average 22,000-33,000 tests a day, including testing asymptomatic people who wish to be tested in some regions.
But, some provinces are testing a mere 300-500 a day, or fewer – and haven’t been testing for community spread! BC, a huge province, tests 1,500 a day, and bumps it up to 2,500 a day when their cases spike. None are testing random groupings (everyone in a building, for example), which helps uncover the prevalence of asymptomatic cases.
The federal government has offered the provinces support for testing and contact tracing so that they can increase their capacity, but I haven’t seen much change in the numbers.
International evidence shows that when testing for community spread (all symptomatic people at a minimum, even if symptoms aren’t “typical” COVID-19, plus testing for asymptomatic cases such as all the people in an apartment building), the lower the percentage of positive tests (ie cases), the more likely the jurisdiction is doing sufficient testing to identify and then isolate all cases. International jurisdictions with very high percentage positives experienced out-of-control increases in cases, while jurisdictions such as South Korea were doing massive testing and the positive test results are about 2%.
Ontario’s testing far outstrips any other province, and has conducted 2.5 times the tests of Quebec. And Alberta’s total number of tests about 75% of Quebec’s, despite having half the total population – and Quebec having six times the cases.

The positive testing rate is still improving (ie falling). Quebec’s is down to 7.5%. Every other province is under 2%! Ontario’s has fallen to 1.9%, which is a sign they may be catching most of the cases, and hopefully will start to truly control their outbreaks. Nova Scotia’s is 1.7%, Alberta’s is 1.6%, BC is at 1.4%, Saskatchewan is at 1.3% and Newfoundland is 1.1%. All other provinces are under 1%, which indicates testing rates are hopefully sufficient.
In Chart 15, you can see that Ontario has significantly increased its rate of testing (this is a good exponential curve!), and Alberta’s increased as well. Quebec… while the daily samples taken appear to be an increase, the curve shows the total numbers have actually decreased because Quebec revised the method for calculating negative cases on July 22. BC’s testing rate is finally slightly higher.
The other provinces have barely increased their testing – which is fine when they’ve controlled the epidemic in their jurisdictions, but does raise concerns now that most of them are in outbreak and they haven’t increased their testing further.
Note: the gaps are because several provinces do not report on weekends/Sundays, plus I missed June 7 due to a family death.

But the amount of testing needs to be relative to the population size. While Ontario and Quebec are doing a lot of tests in absolute numbers, it’s actually Alberta that has the highest testing rates by population! Ontario’s increases have brought it from lowest rate in Canadato second-highest, closing in on Alberta. Tiny PEI is third, an island with sealed borders. All of these are conducting more than 100,000 tests per million population. Quebec is fourth, at only 91,000 tests per 1 million population. Thus, this plus their positive test rate and low daily testing numbers indicates they are not yet testing enough to identify, contact trace, and isolate all the cases. Yukon, Nunavut, and Newfoundland have the fewest tests by population, as well as small populations. And notice that the Northwest Territories are testing at a higher rate than New Brunswick, Nova Scotia, Manitoba, and BC. BC’s continued low testing rates are troubling because unlike Nunavut, Yukon, and Newfoundland, it does not have sealed borders. One worries about BC’s capacity now that outbreaks have started once again. We’ll have to watch closely because this will hint at what’s to come in the fall.

We’ve learned from South Korea, Taiwan, Singapore, and Hong Kong the importance of testing. Based on international best practices, I think few provinces are testing optimally.
UPDATE IN PROGRESS – I’M TO HERE
Seniors in Ontario
A lot has been said about the outbreaks in long-term care facilities – there’s been many horrifying news stories. First, there were outbreaks in B.C., which should have served as a warning to other provinces, but unfortunately they did not take appropriate preemptive action to protect the most vulnerable in our communities.
Most provinces are including information about these institutions; here is my high-level analysis of Ontario’s situation. Ontario had the worst outbreaks in long-term care facilities on the continent, and most of the province’s deaths have been among these vulnerable populations.
There are currently 12 institutions in Ontario with an average outbreak (down from last week’s 18, previous 23 then 36 then 57). Of these, 8 (62% of the institutions) have had no deaths among residents, and another 1 had had fewer than five resident deaths. That leaves 4 institutions (31%) with five or more deaths among residents. There have been between 7 and 46 deaths in these 4 institutions. Particularly egregious is Madonna Care in Orleans (46 deaths) and Villa Columbo in Toronto (32 deaths). The average number of deaths in these high-mortality institutions was 24 residents. The province also notes that 8 staff members died (one more this week) although these tables do not link these deaths to specific institutions.
Ontario reports 1,844 deaths in long term care homes among residents, and 8 among staff, out of the 2,759 Covid-related deaths in the province. That means that these residents’ deaths account for 67% of the Covid-19 deaths in Ontario.
Of the 12 institutions with outbreaks, 9 (69%) have had no cases among residents. There are two institutions with deaths among residents but no confirmed cases among residents. 2 institutions had fewer than five cases, and only 1 had five or more confirmed cases among residents (particularly notable were Nisbet Lodge in Toronto, now with 9, up from last week’s 8 now, but improved from the previous week’s 33 cases, and Villa Columbo also in Toronto, with five now, down from 18 last week and 23 the week before. Nisbet has the same number of deaths as last week, but Villa Columbo is up three).
Many of the institutions currently with outbreaks have cases among staff. 3 institutions with active outbreaks have no staff cases; 9 institutions have fewer than five staff cases, while 1 has five or more staff cases. The maximum number of confirmed staff cases is 18 at Nisbet Lodge.
There are 7 institutions which have had staff cases but have had zero resident cases or deaths. These institutions protected their residents. However, where there are more than 10 staff cases, the average number of resident cases is 9 (previously, 8, and before that, 16), and the average number of resident deaths is 7 (previously 14).
Among the 312 (up from last week’s 299, previously 295, 279, and 258) long term care institutions in Ontario which no longer have active outbreaks – 11 new ones. Of these, 212 (68%) have had no deaths among residents. An additional 28 had fewer than five deaths. There were 72 institutions (23% of the total) which had five or more deaths, and the average number of deaths among these was 23 with a range of 6 – 70 deaths. In these institutions, an average of 17% of their residents died (deaths/number of beds), with a horrifying maximum of 45% in one institution. Orchard Villa had those 70 deaths, and the Pinecrest Nursing Home in Bobcaygeon had that 45% of all beds dying.
In the Ottawa area, there was 1 institution (down from 2 last week and 7 three weeks ago) with an active outbreak, and 23 (up from 20 three weeks before, and 16 the week prior to that) which previously had outbreaks. However, for some reason, this data does not reflect the news report late last week that Carlingview had a new outbreak.
The institution back in outbreak was Madonna Care Community; it’s had 46 deaths from Covid-19, which is more than a quarter of its the residents. And, of course, the Carlingview Manor has already had 20% of the beds die from Covid.
| LTC Home | City | Beds | Confirmed Resident Cases | Resident Deaths | Confirmed Staff Cases | % deaths of beds |
| Madonna Care Community | Orleans | 160 | 0 | 46 | 0 | 28.75% |
Of the homes no longer in outbreak, and 7 had 10% or more of their residents die from Covid-19: Almonte Country Haven (35%), Montfort (23%), Elisabeth-Bruyere Residence (21%), Carlingview (20%), Manoir Marochel (14%), Extendicare Laurier Manor (10%), and Stoneridge Manor (10%), an appalling situation. The number of deaths at these institutions ranged from 6 (Stoneridge) to 61 (Carlingview).
The Perley had 12 deaths but that was 3% of the beds; two other institutions had fewer than ten deaths, that amounted to less than 5% of all their residents. The remaining institutions did not have any resident deaths.
| LTC Home | City | Beds | Resident Deaths | % deaths of beds |
| Almonte Country Haven | Almonte | 82 | 29 | 35.37% |
| Montfort | Ottawa | 128 | 30 | 23.44% |
| Élisabeth-Bruyère Residence | Ottawa | 71 | 15 | 21.13% |
| Carlingview Manor | Ottawa | 303 | 61 | 20.13% |
| Manoir Marochel | Ottawa | 64 | 9 | 14.06% |
| Extendicare Laurier Manor | Gloucester | 242 | 25 | 10.33% |
| Stoneridge Manor | Carleton Place | 60 | 6 | 10.00% |
| Residence Saint-Louis | Ottawa | 198 | 9 | 4.55% |
| Peter D. Clark Centre | Ottawa | 216 | 8 | 3.70% |
| The Perley and Rideau Veterans’ Health Centre | Ottawa | 450 | 12 | 2.67% |
| Bonnechere Manor | Renfrew | 180 | 0 | 0.00% |
| Centre d’Accueil Champlain | Vanier | 160 | 0 | 0.00% |
| Extendicare Medex* | Ottawa | 193 | 0 | 0.00% |
| Extendicare Starwood | Nepean | 192 | 0 | 0.00% |
| Extendicare West End Villa | Ottawa | 242 | 0 | 0.00% |
| Garden Terrace | Kanata | 160 | 0 | 0.00% |
| Garry J. Armstrong Home | Ottawa | 180 | 0 | 0.00% |
| Glebe Centre | Ottawa | 254 | 0 | 0.00% |
| Lanark Lodge | Perth | 163 | 0 | 0.00% |
| Maxville Manor | Maxville | 122 | 0 | 0.00% |
| Miramichi Lodge | Pembroke | 166 | 0 | 0.00% |
| St. Patrick’s Home | Ottawa | 288 | 0.00% | |
| Villa Marconi | Ottawa | 128 | 0 | 0.00% |
Personally, I’m hoping that there will be criminal charges against the worst of the worst of these institutions across the country.
Travel Sources
NOTE: I’m not updating this section anymore, because borders are closed and only the Northwest Territory was indicating new cases from travel in recent weeks.
Since many cases came from travel, I explored the identified sources. I think this is an important part of the story, even if the case information is now very spotty. I’m keeping this section as a “legacy” section.
There were 459 cases publicly identified as having recently traveled. There’s double counting in my data set (which counts 559 travel cases), because some earlier batch reports listed several locations without making clear which cases went where, and a few traveled to multiple countries in one trip. I’m including my analysis despite the known errors, as it clearly shows that the virus arrived in Canada from countries other than China even while everyone’s focus was on the outbreak in Wuhan. Most of Canada’s cases came from the U.S. and Europe, where the information is publicly available.
| China | 8 | 1.46% |
| Other Asia | 21 | 3.83% |
| Iran | 37 | 6.74% |
| Egypt | 56 | 10.20% |
| Italy | 8 | 1.46% |
| Other Europe | 84 | 15.30% |
| U.S. | 107 | 19.49% |
| Latin America | 45 | 8.20% |
| Other countries | 14 | 2.55% |
| Domestic travel | 13 | 2.37% |
| Cruise | 47 | 8.56% |
| Location not specified | 109 | 19.85% |
| Total: | 549 |
- “Other Asia” includes India, the Philippines, South Korea, Japan, Hong Kong, Taiwan, Malaysia, and unspecified “Asia”
- “Other Europe” includes England, UK, Austria, France, Germany, Switzerland, Ukraine, Netherlands, Spain, Portugal, Greece, Switzerland, and Turkey
- The US includes cases from specific states (Colorado, Florida, Las Vegas, Oregon, Seattle, Washington DC, Arizona, Tennessee) as well as US unspecified
- Latin America includes Trinidad and Tobago, Mexico, Panama, Costa Rica, Ecuador, Brazil, Puerto Rico, Barbados, Bahamas, Dominican Republic, Peru
- “Other countries” includes Jordan, Nigeria, Australia, Israel, Dubai
- “Domestic travel” includes people who went to Toronto and Vancouver conferences, Alberta, and Moncton.
To see the patterns of where the travel-related sources of COVID-19 had recently visited, I did a cumulative count of the cases, by region, over time. You can see the first cases were from China and the cruises but China as a source stopped quite early in the Canadian experience. Next early sources were people returning from trips and tours to Iran and Egypt, then returns from other parts of Asia, Italy, elsewhere in Europe, and from Latin America. The most cases from are from the US, and the second most common source is where the travel location is not publicly specified. There are more cases from across Canada than there are from other countries or the cruises.
Canada’s shut the border to non-essential travel, and required the Canadians to come home. This has changed the daily (publicly announced) count of travel-related cases. Given the incubation period of 1-2 weeks, it will be another week or two until these numbers should drop significantly.

Here, you can see the impact of closing the border and imposing a mandatory 14-day quarantine on all arriving Canadians, even taking into account that there are some domestic travel cases in the data set:

Data Sources
I use the provinces’ and territories’ daily case updates on their websites, validating with the excellent case by case listing published by CTV news.
That said, there are other sources:
- At the national level: PHAC is publishing some details but far less than most provinces; its ArcGIS map is at the provincial level only, not by health unit, so really no difference between it and the John’s Hopkins dashboard. Statistics Canada (with PHAC) are starting to publish case details.
- Almost all provinces now provide their data in infographic format, and some are now providing epidemiological analysis sheets (Ontario, Alberta, Newfoundland, British Columbia in particular). BC’s daily surveillance summaries (published Monday-Friday) has information similar to some my analysis (scroll down to the Surveillance Report section)..
- Ontario was the first to make much their full data sets public everyday, and Alberta and BC now are, as well.
- The University of Toronto public health programme are doing Canadian analysis with the same data sources I’m using and is publishing several very interesting charts and analyses – but they’re presented oddly flattened and the details aren’t always clear.
- Project Pandemic has some good data visualizations, particularly of outbreaks on indigenous lands, in long term care facilities and retirement homes, in federal prisons, and in public health units in Ontario. This project is coordinated by Concordia’s Institute for Investigative Journalism, supported by the Canadian Association of Journalists, and hosted by CTV.
- In fact, the quality of CTV’s reporting outstanding (link above) – they’re actually more reliable on tracking daily cases than the provinces themselves, with their reporters going to each health unit and more than once (and more than one province!) having complete data that the provinces was missing… and later caught up to CTV’s numbers.
- The ArcGIS map of cases in each public health district across Canada; they’ve improved the design and now you can get a really good visual of how the cases are mapped out across Canada. My favourite thing about it is that they’ve colour-coded the health units by cases per 100,000 population, and overlaid circles with the number of cases – so you can really get a sense of the severity of the outbreaks in each area. You can see how the outbreak varies across provinces, let alone the country.
Oddly enough, as far as I’m aware of, I’m still one of the few publishing publicly a full analysis of the cases. This strikes me as peculiar, because everyone, public health official and “civilian” alike, are finding the Johns Hopkins and Webometers and other sites very informative and helpful.
I’ll try to keep this up to date, as long as (a) the public health units, and CTV, keep publishing the data I need, and (b) there is no national analysis of this type. I really find it helpful to see how this pandemic is playing out across Canada, and wish PHAC or Statistics Canada would publish this more complete story. It is, however, a lot of work on top of my day job, and it eats up almost all of my free time. I’ll likely stop once the numbers drop enough – or I reach the limits of my tools and I have to rebuild them.
Healthcare is a provincial responsibility in Canada. As a result, the provinces vary considerably in terms of when they are imposing or loosening restrictions on activities, what restrictions they order, on how they report, their criteria to test, and their testing capacity. As a result, they vary considerable in the severity of their outbreaks. By March 20, it was already readily apparent in the number of cases; future research should track closely the efforts by each province and major city to mitigate and suppress the outbreak and when the numbers started changing. I’d also like to see a breakdown of how the epidemic plays out in each public health unit in each province. Unfortunately, I don’t have the capacity to do that and my day job… at least until Ontario, Quebec, and Alberta report fewer cases each day! So I’m doing the provincial breakdowns for only Ontario and Quebec, as they have the most cases.

Pingback: Covid-19: Interesting articles | Musings and hobbies